Monitoring & observability
Datadog
Cloud observability for metrics, traces and logs, with nothing to host yourself.
paid / trialcloud
| Platforms | SaaS (web + mobile); agent for Windows/Linux/macOS |
|---|---|
| Licence | Paid (trial) — proprietary SaaS |
| Price | Free up to 5 hosts; Infrastructure from $15/host/mo |
| Section | Monitoring & observability |
| Updated | 2026-11-05 |
What it is
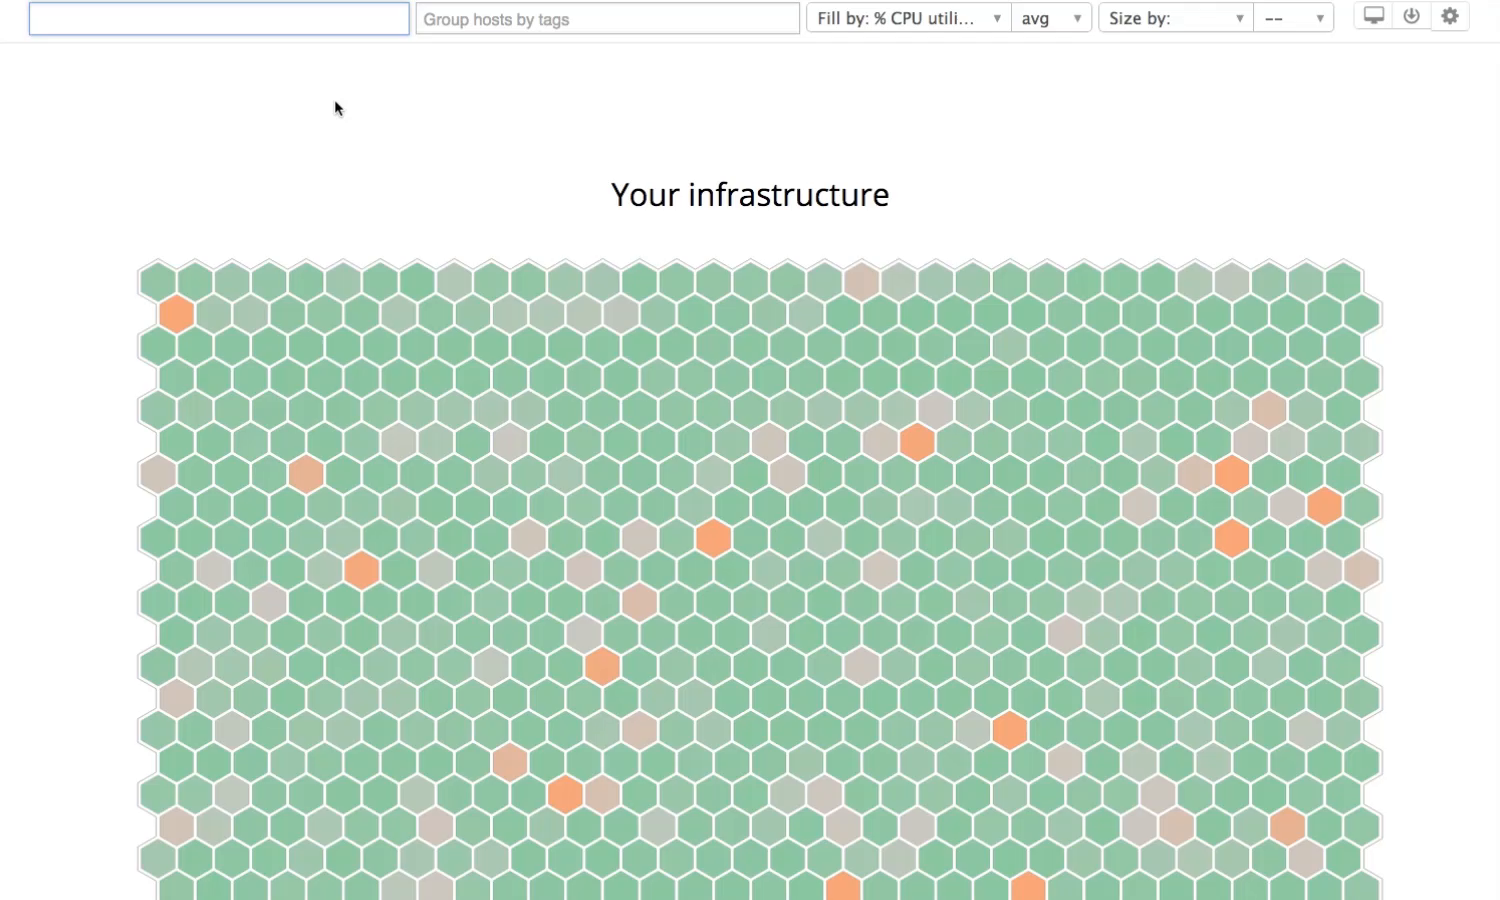
Metrics, traces (APM), logs and alerting all land in one web UI, backed by hundreds of integrations. It watches hybrid infrastructure without you running a single monitoring server.
Problems it closes
- You’d rather not operate and scale an in-house monitoring stack.
- Metrics, traces and logs need correlating in one place.
How administrators run it
- Drop the agent on hosts and switch on integrations for the services you run.
- Build dashboards and monitors, and link APM traces to logs as incidents unfold.
Strengths & trade-offs
Strengths
- Nothing to run in-house.
- Metrics, APM and logs share one home.
- Hundreds of integrations.
Trade-offs
- Usage billing can climb fast.
- Your data leaves the premises for the vendor cloud.
Common questions
Can you self-host it?
No — it’s SaaS. You install an agent and data flows to Datadog’s cloud.
How does pricing work?
Usage-based — per host, plus APM, logs and more — with a free tier up to 5 hosts.
Alternatives
Grafana Dashboards and visualisation layered over Prometheus, Zabbix, databases and clouds. open sourcecloud + desktop Linux/Windows/macOS/Docker, web; cloud Prometheus Time-series monitoring and alerting, the default in cloud-native stacks. open sourcedesktop Linux/Windows/macOS, web UI; CNCF Zabbix Open-source monitoring across servers, network gear, VMs and applications. open sourcedesktop Linux/Unix server, web UI; agents for Windows/Linux/macOS/Unix