Monitoring & observability
Grafana
Dashboards and visualisation layered over Prometheus, Zabbix, databases and clouds.
open sourcecloud + desktop
Independent reference — this page is a review. Grafana is downloaded from the vendor’s official site, not from here.
| Platforms | Linux/Windows/macOS/Docker, web; cloud |
|---|---|
| Licence | Open source — AGPL-3.0; Grafana Cloud free + paid |
| Price | Free (OSS); Grafana Cloud free tier + paid |
| Section | Monitoring & observability |
| Updated | 2026-11-05 |
What it is
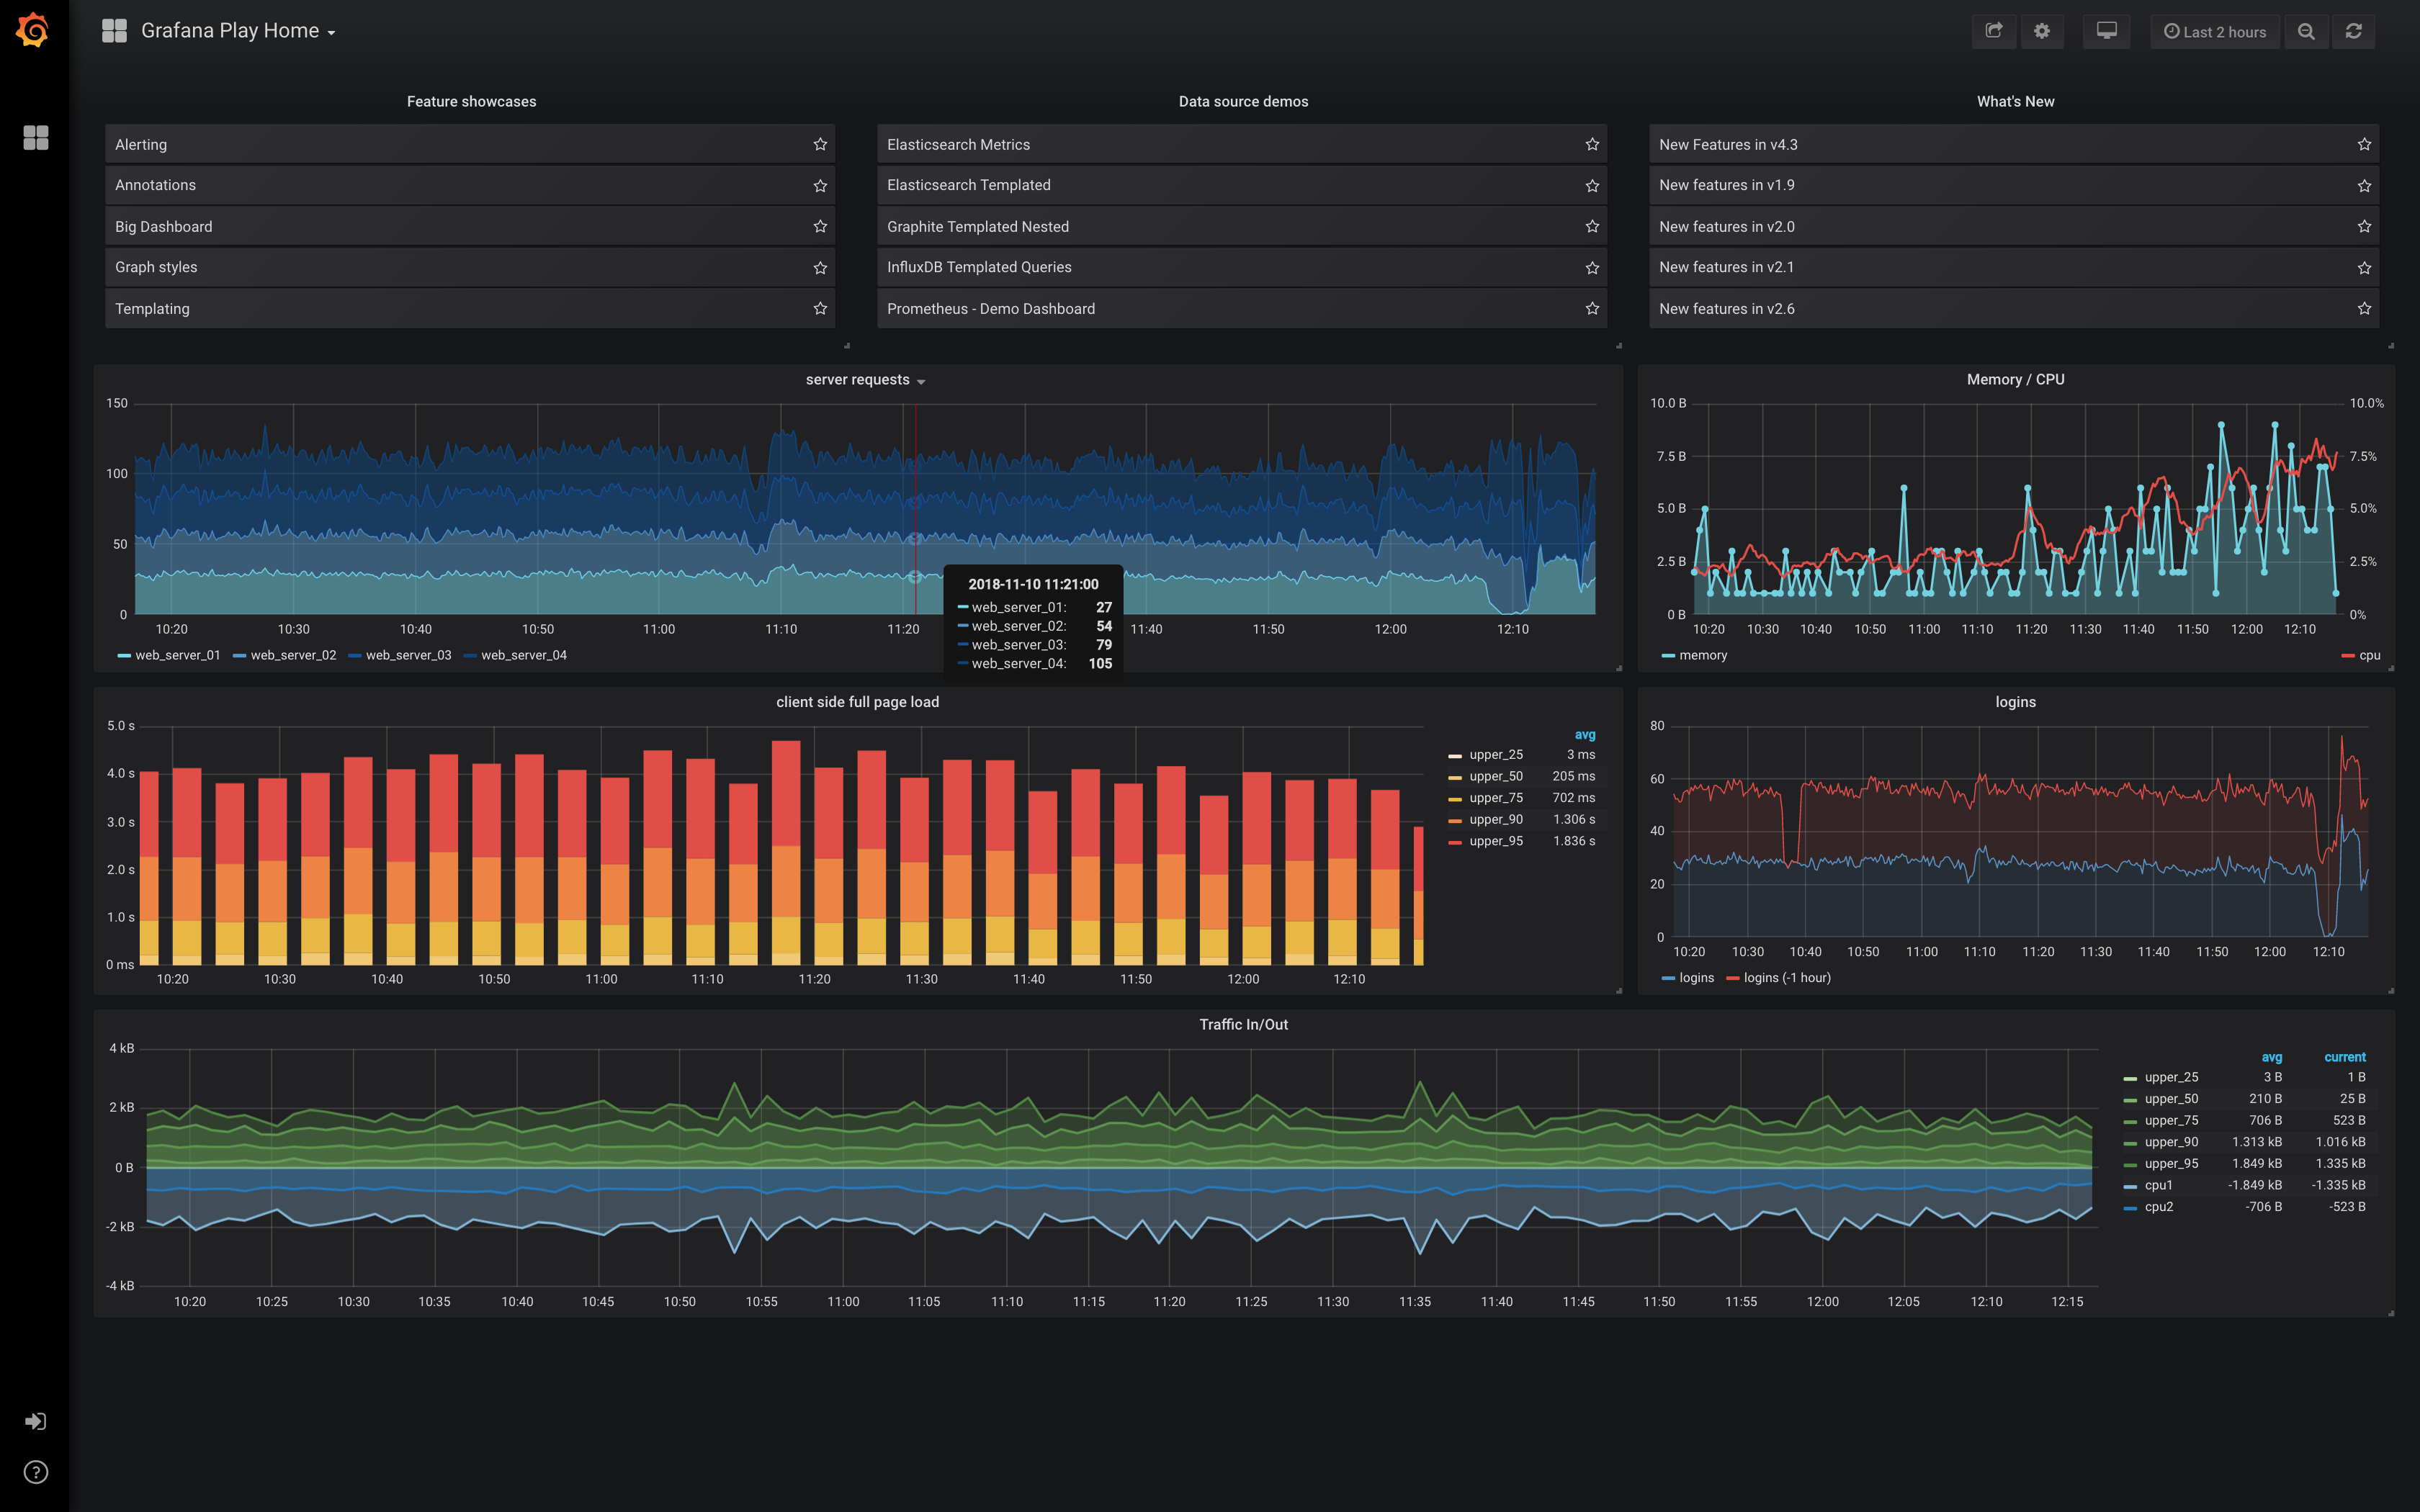
Treat it as the visualisation and analytics layer, nothing more. It plugs into Prometheus, Zabbix, databases and cloud providers, then turns their data into interactive dashboards and alerts — one pane of glass over whatever is already taking measurements.
Problems it closes
- Metrics are spread across several systems and you want one dashboard over all of them.
- Teams want self-service dashboards without poking at the underlying data stores.
How administrators run it
- Add Prometheus and Zabbix as data sources and build shared dashboards on top.
- Set alert rules and route them to on-call channels.
Strengths & trade-offs
Strengths
- Connects to nearly any data source.
- The dashboards are first-rate.
- Comes as an OSS build and a managed cloud.
Trade-offs
- It visualises, it doesn’t collect — you still need a metrics backend.
- Getting alerting set up takes some learning.
Common questions
Does it store the metrics itself?
No. It visualises data pulled from backends like Prometheus or Zabbix; you still need a data source.
What does it cost?
The open-source edition is free; Grafana Cloud adds a free tier plus paid plans.
Alternatives
Prometheus Time-series monitoring and alerting, the default in cloud-native stacks. open sourcedesktop Linux/Windows/macOS, web UI; CNCF Zabbix Open-source monitoring across servers, network gear, VMs and applications. open sourcedesktop Linux/Unix server, web UI; agents for Windows/Linux/macOS/Unix Datadog Cloud observability for metrics, traces and logs, with nothing to host yourself. paid / trialcloud SaaS (web + mobile); agent for Windows/Linux/macOS